
Core Web Vitals 2026: Your Weakest Link Sets the Grade
Mission Briefing — the 30-second version. Google grades your site on three things: how fast the main content shows up, how fast the page answers a tap, and whether it holds still while it loads. Those are the Core Web Vitals, and the targets haven't changed in 2026. The catch is that Search Console grades a group of pages by its worst score. Find your weakest one, on phones first, and fix that.
Think of it this way. A customer walks in your door, and it takes a long time for anyone to greet them. What's going to happen?
They walk back out. Load times are no different. What happens in the first second matters, and Core Web Vitals are how Google keeps score of it. Learn the three numbers, and "my site is slow" turns into a to-do list.
First, Let's Clear Up a Myth
You may have seen articles claiming Google rolled Core Web Vitals into a new "composite score" in 2026, or tightened the loading target to 2 seconds. We checked the source. Google's official Core Web Vitals page still lists three separate metrics with the same targets, and it was last updated in December 2025.
No new formula. No secret score. The rules that count are the ones Google publishes.
Think of It Like a Report Card
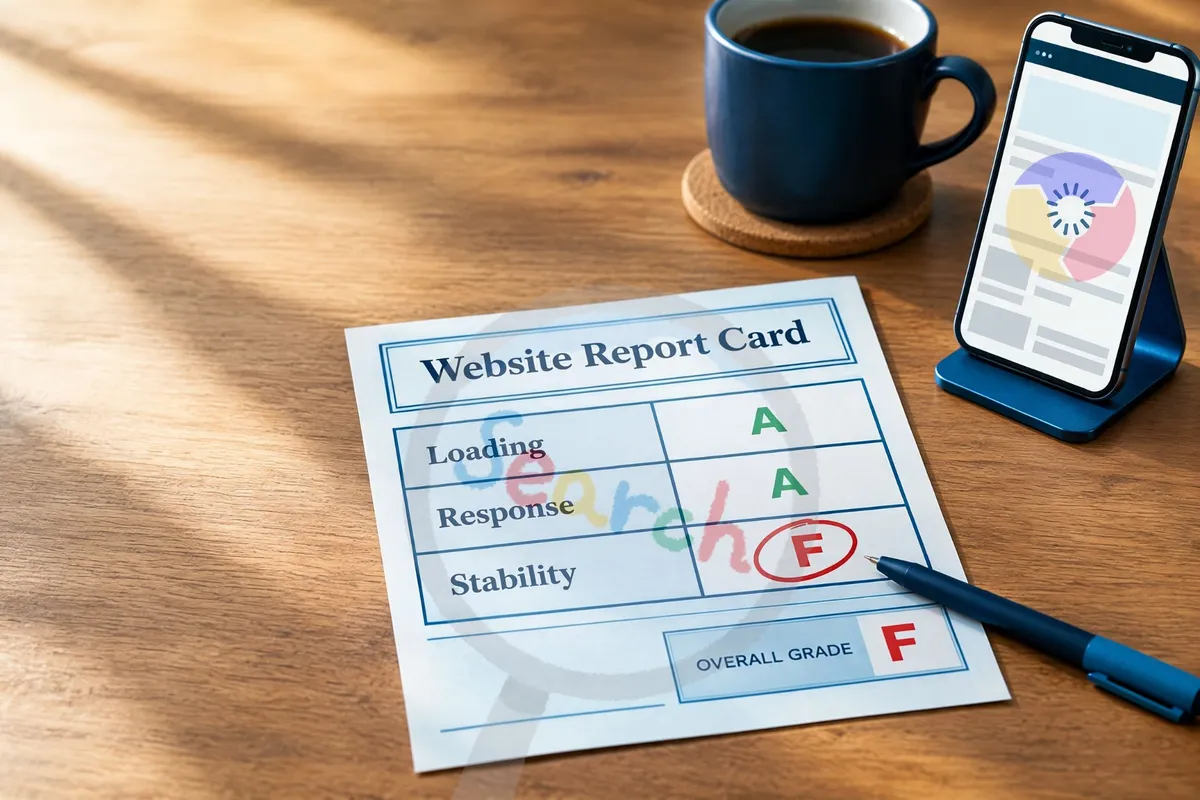
Picture a kid bringing home a report card from the strictest school in town. Three subjects. Their lowest grade becomes the grade on the whole card. Two A's and an F? That's an F.
That's exactly how Search Console grades your pages. In Google's own help docs, a group of pages gets the status of its most poorly performing metric. Your page can react to a tap instantly, and if it jumps around while it loads, Google still calls it "poor."
So don't spread your money across everything. Find the F. Fix the F.
The Three Metrics, in Plain English
1. LCP — Largest Contentful Paint (loading)
What it measures: the time it takes for the biggest thing on the screen to show up. On most small-business sites that's the big photo at the top, or the headline. Google's target: 2.5 seconds or less from the moment the page starts loading. At the door: how long the customer stands there before somebody shows up at the counter.
2. INP — Interaction to Next Paint (responsiveness)
What it measures: the lag between a tap and the page doing something. They hit the menu, the Call Now button, the quote form. Does it respond, or just sit there? Google's target: under 200 milliseconds. That's a fifth of a second. At the door: they ask a question. Do you answer, or stare at them?
3. CLS — Cumulative Layout Shift (visual stability)
What it measures: how much the page moves around while it loads. You've done this. You reach for a button, a banner pops in above it, everything drops an inch and you hit the wrong thing. Annoying for you. Lost lead for the business. Google's target: a score under 0.1. At the door: does the floor hold still when they step inside?
| Metric | Measures | Good | Poor |
|---|---|---|---|
| LCP | Loading | 2.5 s or less | Over 4 s |
| INP | Responsiveness | 200 ms or less | Over 500 ms |
| CLS | Visual stability | 0.1 or less | Over 0.25 |
Source: Google Search Console Help, Core Web Vitals report. Each status reflects what 75% of real visits experienced over the last 28 days.
How Much Does Speed Actually Matter?
Here's Google in its own words: "We highly recommend site owners achieve good Core Web Vitals for success with Search." It also says good scores, along with other page experience signals, line up with what its core ranking systems seek to reward.
Now, let's be straight about it. Speed won't save a weak page. If the page doesn't answer what the customer came for, loading fast just gets them to the disappointment quicker. A useful page that's a little slower can still win. Speed is the greeting at the door. It buys you enough time to make your case.
What I Find on Slow Sites
The one I see most: oversized photos, and not in WebP format. A photo straight off a phone can outweigh the rest of the page, and the visitor waits on every byte of it.
I was working with a client who was getting killed on shifts because of font loads and image sizes. He had oversized logos in both the header and the footer, images that weren't sized right, and seven different fonts on the website. That caused a loading and shifting nightmare. Once we fixed the logos and images and cut the fonts, his score on Google's PageSpeed Insights jumped 20 points.
The mobile mistake that cost one company almost all its phone traffic
Here's the realistic side. I was working with an outdoor services client whose leads dropped, and they could not figure out why. After looking at the numbers, we found it: the agency they hired had redesigned the site and optimized for desktop speed, and forgot about mobile. As a result, the share of their traffic coming from cell phones dropped from 67% to 3%.
After we optimized for phones, it climbed back into the sixties. Same business, same services. The only thing that changed was how the site treated the phone in the customer's hand.
How to Check Your Scores (Free)
Google Search Console, Core Web Vitals report. Shows how groups of your pages perform for real visitors, split into mobile and desktop, and labels them Good, Needs Improvement or Poor.
PageSpeed Insights (pagespeed.web.dev). Type in any address. You'll see real-visitor data when Google has enough of it, plus a lab test with specific suggestions.
Check mobile first. Your site can look perfect on the big monitor in your office and still fail the homeowner standing in the driveway with a phone in one hand.
Go Deeper: Field Data vs. Lab Data
Field data is what actually happened. Real people, on real phones, on whatever signal they had, visiting your site in Chrome. Google collects it in the Chrome User Experience Report, and Search Console's Core Web Vitals report runs on it.
Lab data is a test drive. PageSpeed Insights loads your page once under set conditions and tells you what slowed it down. Great for finding the problem. But it's one run, not your customers.
Why they don't match: the test drive happens on a clean road. Your customers are on a three-year-old phone with two bars in a parking lot. When the numbers disagree, trust the field data for what is happening and use the lab data to find out why.
Give it time: field data covers the last 28 days, so the report won't change the day after you fix something. Once you've made the fix, click "Start Tracking" on that issue in Search Console. Google watches your real visitors for 28 days. If the problem doesn't show up on any page in that window, it gets marked fixed.
The Most Common Fixes
To improve LCP (loading)
Size your photos to how big they actually show on the page, and save them as WebP. This is the big one.
Let the top photo load right away. Some sites are set to hold it back until last, which is backwards.
Don't cheap out on hosting. A good host with a content delivery network (CDN) gets your page to the customer faster.
Compress images and text. Google's own 2017 study of mobile pages found 30% of them could save more than 250 KB that way.
Cut the extra code that has to load before the page can show anything.
To improve INP (responsiveness)
Pull the plugins, widgets and tracking tags nobody's using anymore. Every one of them costs time.
Anything that isn't needed to show the page, like chat widgets and extra trackers, loads after the page, not before.
Have your developer break up the long chunks of JavaScript so the page can answer a tap in between.
To improve CLS (stability)
Give every image and video a set width and height, logos included. That's how the page knows how much room to save.
Save the space for banners, maps and embeds before they show up.
No pop-ups or banners that shove the page down after it appears.
Use as few fonts as you can. One or two is plenty. Seven is a nightmare, I've seen it.
What You Can Fix Yourself, and What to Hand Off
Images. Pull them into Canva or a photo editing program and make the adjustments: the size they're shown on the page, saved as WebP. If you're smart, you'll have an AI tool write you a prompt with Google's requirements in it first, so you know the exact sizes and format before you start.
Fonts, themes, scripts and layout are a different job. Hand those to someone who knows your site, and tell them to check it on a phone before they call it done.
Your Orders: What to Do This Week
Open the Core Web Vitals report in Search Console and note your worst metric on mobile.
Run your top three pages through PageSpeed Insights. For most of you, that's the home page and the two services that make you the most money.
Fix the F first. Start with your photos.
Click "Start Tracking" on the issue in Search Console and check back after the 28-day window.
Then go after the next-worst score. Repeat.
The Bottom Line
You don't need a perfect 100. You need to stop losing people at the door. Find your weakest link. Fix it. Move to the next one.
We've always been told speed kills. In the world of load times, it's slow that kills: the customer goes somewhere else. Find the balance.
Frequently Asked Questions
What are Core Web Vitals?
They're three scores Google uses to judge a page from the visitor's side: LCP, how fast the main content appears; INP, how fast the page reacts to a tap or click; and CLS, how much the layout jumps while it loads.
How do I improve Core Web Vitals?
Start with your worst score on mobile. For most small-business sites that means resizing photos and saving them as WebP, cutting extra fonts and plugins, and reserving space for images and banners so nothing jumps. Then click Start Tracking in Search Console and let Google check its 28 days of visitor data.
What is a good INP score?
Google's Core Web Vitals guide says less than 200 milliseconds. Search Console's report counts 200 milliseconds or less as good and over 500 as poor.
Did Google change Core Web Vitals in 2026?
Not according to Google's own documentation. It still lists the same three metrics and targets, and the page was last updated in December 2025. Claims of a new composite score or a 2-second loading target aren't backed by Google.
Why does Search Console say my pages are poor when most scores look good?
Because a group of pages takes the status of its worst metric. One poor score makes the whole group poor, even if the other two are good.
Will fixing Core Web Vitals boost my rankings?
It can help. Google says it highly recommends good Core Web Vitals for success with Search, and that they work alongside other page experience signals its ranking systems reward. They don't replace helpful, trustworthy content.
Next up, Part 3: AI Is a Tool, Not a Cheat Code — what Google really says about AI-written content, and the spam trap that catches businesses by surprise.
Want a second set of eyes? Oculus Intel offers a free SEO and AEO audit. We'll show you where you stand and what to fix first.
Sources
Google Search Central, "Understanding Core Web Vitals and Google search results" (last updated Dec 10, 2025) — developers.google.com/search/docs/appearance/core-web-vitals
Google Search Console Help, "Core Web Vitals report" — support.google.com/webmasters/answer/9205520
Google Search Central, "Understanding page experience in Google Search results" — developers.google.com/search/docs/appearance/page-experience
web.dev (Google), metric guides for LCP, INP and CLS — web.dev/articles/lcp, web.dev/articles/inp, web.dev/articles/cls
Think with Google, "Find out how you stack up to new industry benchmarks for mobile page speed," February 2017 — thinkwithgoogle.com
PageSpeed Insights — pagespeed.web.dev